
Introduction
The economy of Jordan is among the smallest in the Middle East, where there is an insufficient supply of water, oil, and other natural resources, which are only exacerbated by the Government’s heavy dependence on foreign aid. In addition, the Jordanian Government faces other economic challenges, such as chronic high unemployment rates, disguised unemployment, budget, current account deficits, and governmental debt.
During the years 2000-2010, King Abdullah II implemented strategic economic reforms, such as expanding foreign trade and privatization of state-owned enterprises, in turn, attracting foreign investment and contributing to the increase of the average annual economic growth by 8% in the years 2004 to 2008.
According to the US Intelligence Agency’s World Factbook, the global economic slowdown and regional turmoil contributed to slack in growth from 2010 to 2017, with an average annual growth rate of about 2.5%, and damaged export-oriented sectors, construction (real estate), and tourism.
Since the beginning of the civil war in Syria and the resulting refugee crisis, one of the most pressing social and economic challenges proved to be the influx of over 666,000 Syrian refugees as reported by the UN; Over 80% of them live in Jordanian urban areas. Jordan’s official census estimated the number of refugees at 1.3 million Syrians early in 2016.
According to UNHCR, the Coronavirus epidemic negatively affected both refugees and Jordanians. Unprecedented humanitarian needs also emerged in 2020. While the UNHCR was able to address the most important vulnerabilities, it could not stop growing poverty levels.
According to a study released by UNHCR and the World Bank in December 2020, since the beginning of the Covid-19 pandemic, poverty levels have increased by 38% among Jordanians and 18% among Syrian refugees, whose poverty rate was already high.
Jordan is almost entirely dependent on imported energy – mostly natural gas – and energy accounts for 25-30% of Jordan’s imports. The Kingdom has secured several contracts for liquefied natural gas and pipelines to diversify its energy mix and has developed several major renewable energy projects.
In August 2016, Jordan and the International Monetary Fund approved long-term facilities worth $723 million, building on the IMF’s $2.1 billion programs, which ended in August 2015, intending to help Jordan correct its budget imbalances and balance of payments.
Jordan is currently facing successive waves of New Coronavirus infections (COVID-19) while key indicators of the country’s economy continue to deteriorate. The double deficit has increased significantly, and the level of public debt has risen, with unemployment rising.
However, the impact on Jordan’s economic growth during 2020 remained relatively modest compared to its counterparts. Jordan’s economic prospects for the next phase will largely depend on the recovery of global demand and international travel, as well as the pace and scope of domestic vaccination campaigns against the coronavirus.
Economic activity in Jordan contracted 1.6% during 2020. The impact of the shock on the gross domestic product (GDP) remains relatively limited compared to those of other countries. Despite this fact, the Covid-19 pandemic had a devastating impact on the country’s travel and tourism sector, which was contributing to about 18% of gross domestic product and total jobs in 2019.
In the short term, the World Bank expects several policy measures to support the economy of Jordan, including increased wages for public sector employees, social safety net programs, and increased minimum wages. Export sector performance is expected to improve as demand increases in the United States and GCC countries.
However, short-term growth faces significant adverse risks due to increased cases of coronavirus infection, slow vaccinations, and medium-term prospects continue to be hampered by chronic structural imbalances and weaknesses in the country.
Gross Domestic Product
The preliminary results of the quarterfinal estimates of GDP at fixed market prices for the second quarter of 2021 showed growth of 3.2% during the second quarter of 2021 compared to the second quarter of 2020.
Estimates also showed that economic sectors grew during the second quarter of 2021 compared to the second quarter of 2020. According to the General Statistics Service, the construction sector achieved the highest growth rate during this period of 5.7%, the extractive sector with 5.4%, followed by transport, storage and communications with 4.3%, manufacturing with 3.9%, and wholesale, retail, hotel, and restaurant with 3.8%.
Regarding sectoral contributions to the 3.2% growth rate achieved during the second quarter of 2021, the manufacturing sector contributed 0.66 percentage points. Finance, insurance, real estate, and business services contributed 0.54 percentage points. Transport, storage, and communications contributed 0.35 percentage points to the total growth rate.
Jordan’s GDP has shrunk in constant prices, a real contraction of about 1.6% in 2020 compared to 2019, driven by the negative consequences of the Covid-19 pandemic since March 2020; Constant GDP growth is down 3.5% from 2019.
According to World Bank data, GDP at constant prices in 2020 was $41.108 billion, down from $648 million in 2019 and 1.6%. GDP per capita fell by more than 2.5% in 2020, compared to 2019, for closures and preventive measures in the face of the Covid-19 pandemic (Covid-19); Prompted the government to announce a stimulus package in spring 2021 to mitigate the negative effects of the pandemic.
GDP (JD = US $ 1.41)
| Indicators | measuring unit | 2019 | 2020 | Change ± |
| GDP (at constant 2015) | Billion US$ | 2020 | 41.108 | -0.648 |
| GDP growth (annual) | US$ | 41.756 | -1.551 | -3.506 |
| GDP per capita (constant 2015) | Billion US$ | 41.108 | 4,029,0 | - 104.6 |
| GDP (at current prices) | Billion US$ | 1.955 | 31.025 | -0.572 |
Source: World Bank.
Industry
Industrial activity is divided into two main sectors contributing about 20% to GDP:
- According to the General Statistics Service, the manufacturing industry, including leather, chemical, food, plastic, information technology, and others, accounted for 83.69% of total industrial exports in 2020.
- The mining sector, considered one of the most strategic sectors, includes phosphate and potash, cement, mining, limestone mining, and others. Exports from this sector, and its subsectors, accounted for 16.31% of the volume of Jordanian industrial exports in 2020.
Jordanian industrial enterprises registered a clear decline for two consecutive years. In 2019, the number of industrial enterprises declined by about 1.9% compared to 2018. In 2018 it also declined by 2.6% compared to 2017. Jordan has seen a marked increase over the years (2013-2017), with an average growth rate of about 2.6% per year during that period. The number of industrial enterprises fell from about 18,200 in 2017 to 17,392 in 2019.
One of the most important challenges facing Jordan’s industrial sector, according to researchers, is the high cost of production in all its forms (energy, transport, raw materials, taxes, and fees).
The construction industry sector is an important economic sector and is a major contributor to construction, real estate, housing, and infrastructure projects.
The total number of establishments operating in the construction industries sector in 2019 amounted to 2,753 compared to 2018 with 2,725 establishments, showing a growth of 1%. Despite the increase in the number of establishments operating in this sector, there was a total registered capital decrease from about 319.4 million Jordanian dinars in 2018 to approximately 312.6 million Jordanian dinars in 2019, recording a decline of 2%.
There are 17,951 workers in establishments operating in the construction industries sector registered in the three sectors of industry (Amman, Zarqa, Irbid) in 2019. In 2018, there were 17,234 workers. These numbers show growth in the number of workers by 4%. This difference came in both industrial and craft facilities operating in the sector. As for exports, the sector’s exports increased from about 94.1 million Jordanian dinars in 2018 to approximately 112.9 million Jordanian dinars in 2019, recording a growth of 20%.
Industry indicators (1 dinars = 1.41 dollars)
| Indicators | measuring unit | 2019 | 2020 | Change ± |
| Number of registered industrial establishments | establishment | 1,509 | 1,251 | -258 |
| Capital of registered industrial enterprises | Million US$ | 116.61 | 50.48 | -66.13 |
| Number of establishments operating in industry | establishment | 17,392 | N/V | - |
| Percentage of industry contribution to GDP | % | 24.09 | 23.47 | -0.62 |
| Industrial export growth rate | % | 7.2 | 1.4 | -5.8 |
| Percentage of industrial exports of national exports | % | 94.0 | 94.4 | 0.4 |
| employees in industry | individuals | 252,505 | N/V | - |
| Percentage of employees in industry to total labor force | % | 24.45 | N/V | - |
Agriculture and Livestock
Agriculture
Agriculture in Jordan is one of the pillars of development in its economic and social dimensions. The land area of Jordan is about 89.3 thousand square kilometres, including the Dead Sea, and is divided into three main climatic/geographic areas: Jordan Valley, upland, and eastern Badia.
The Jordan Valley (Jordan’s food basket) forms the most fertile part of Jordan and extends at altitudes ranging from 220 m below sea level in the north and 407 m below sea level at the Dead Sea. As the Jordan Valley is warmer than the rest of Jordan in winter, it has the advantage of producing vegetables and fruits earlier than the rest of the Kingdom and neighbouring countries.
The high ground extends west of the Jordan Valley to the north and the south, separating the Jordan Valley from the Eastern Badia region. These lands range in height from 600 to 1,500 meters above sea level, receive the largest rainfall in Jordan, and enjoy the broadest natural vegetation. It is home to about 90% of Jordan’s population.
For Eastern Badia, it is approximately 88% of the total area of Jordan, and its territory is between 600 and 900 meters above sea level. Temperatures in these areas vary significantly between day and night and between summer and winter, with rainfall of only 100 millimetres per year.
Jordan has a semi-dry Mediterranean climate, with a rainfall rate of only 90% of its area of 200 mm per year. About 5.5% of Jordan’s area is considered semi-dry land, with rainfall ranging from 200 mm to 300 mm per year, while about 4% receives rainfall of more than 300 mm per year, which can reach about 600 mm per year in the northern highlands.
These rains are characterized by varying precipitation amounts in different regions and a sharp year-on-year fluctuation in quantity and distribution within a single agricultural season.
The area under cultivation in field crops and cereals in 2019 was 783.4 thousand dunams, vegetables 441.6 thousand dunams, and fruit trees (including citrus) approximately 386.5 thousand dunams, with olive trees constituting 954,000 dunams. According to the annual statistical report of the Jordanian Ministry of Agriculture, the total area under cultivation in 2019 is estimated at 2,568,650 dunams, accounting for 3% of the Kingdom’s area.
The Kingdom’s total production of cereals, field crops, and vegetables, as well as the production of fruit trees, was approximately 2.686 million tons.
livestock
Livestock is one of the most important sub-activities of the Jordanian agricultural sector. According to the General Statistical Service, it contributes to the employment of the labour force. It provides decent work and life for various rural citizens as well as basic products, consumed by the general public in the Kingdom.
Data from the Ministry of Agriculture showed a decline in the number of lambs and goats in the Kingdom. Between 2018 and 2019, the rate was 32.8%, reaching 3.02 million in 2019, compared to 4.49 million in 2018. The number of cows was 92,600 in 2019, with little change from the previous year. The total number of camels also maintained numbers of 10,872,000 heads during 2018 and 2019.
Agriculture indicators (1 dinars = 1.41 dollars)
| Indicators | measuring unit | 2018 | 2019 | Change ± |
| Total cultivated area | thousand acres | 2,386.0 | 2,568.7 | 182.7 |
| The area planted with field crops and grains | thousand acres | 525.2 | 683.4 | 158.2 |
| The area planted with fruit trees (except for olives) | thousand acres | 371.0 | 386.5 | 15.5 |
| The area planted with olive trees | thousand acres | 908.0 | 957.2 | 49.2 |
| The area planted with vegetables | thousand acres | 581.0 | 441.6 | -139.4 |
| The amount of agricultural production of different types | million tons | 3.3 | 2.7 | -0.6 |
| Value added in the agricultural sector at current prices | Billion dollar | 2.08 | 2.19 | 0.11 |
| The share of agriculture in the gross domestic product | % | 5.4 | 5.7 | 0.3 |
| agricultural exports | Million dollar | 592.2 | 621.8 | 29.6 |
| Agricultural export growth rate | % | 16.7 | 5.0 | -11.7 |
| Ratio of people employed in agriculture to the total labor force | % | 2.58 | 2.47 | -0.11 |
Source: Department of Statistics, Ministry of Industry and Trade, Ministry of Agriculture, World Bank.
Foreign Trade
The value of total exports in 2020 fell by about 4.45% compared to 2019. The value of national exports rose by 1.04% in 2020 than in 2019. However, the significant decrease in the value of re-exports of 34.6% in 2020, compared to 2019, caused a decline in total exports.
Total imports in 2020 also declined by 12.03% compared to 2019. The trade balance deficit fell by 17.74% in 2020, compared to the previous year.
In terms of commodity composition of the most prominent commodities exported in 2020, the value of national exports of garments and accessories was 23%, raw potatoes 7.5%, chemicals 29.3%, national exports of foodstuffs and live animals 13.8%, vegetables and fruits 5.5% and raw phosphates 4.8%. The proportion of national exports to GDP in 2020 was 16.26% compared to 15.8% in 2019.
Among the most prominent importers in 2020, crude oil imports and its derivatives were 7.7%, machinery and transport equipment 13.5%, foodstuffs and live animals 21%, beverages, and tobacco 1.3%, and pharmaceutical and pharmaceutical products 4%.
Foreign Trade (1D=1.41$) (Billion US$)
| Indicators | 2019 | 2020 | Change ± |
| National exports | 7.039 | 7.113 | 0.074 |
| Re-exported | 1.283 | 0.839 | -0.444 |
| Total Exports | 8.322 | 7.952 | -0.37 |
| Total imports | 19.358 | 17.030 | -2.328 |
| Trade Balance Deficit | 11.036 | 9.078 | -1.958 |
| Ratio of total export coverage to total imports (%) | 43.0 | 46.7 | 3.7 |
Source : Ministry of Industry and Trade.
Poverty
The Minister of Planning and International Cooperation estimated the poverty rate in Jordan to be 24% “phased” in 2021, up about 6% from 2020 due to the Coronavirus. In August 2021, Jordanian authorities declared that more than 15.7% of the population in the Kingdom was below the poverty line, indicating that one-third of the population in the country was considered poor.
The Higher Council for Population (Government), high poverty, brought unemployment to 25% during the first quarter of 2021, up 5.7 percentage points on an annual basis. According to the General Statistics Service data, the unemployment rate among males during the first quarter of 2021 was 24.2%, compared to 28.5% for females.
Poverty and unemployment were exacerbated during the Coronavirus pandemic, owing to the weak capacity of the market to create new jobs, job losses, and the closure and bankruptcy of small and medium-sized pilot enterprises.
In the first half of 2021, Jordan’s Minister of Labour acknowledged that youth unemployment reached 50%, confirming a World Bank report on the country’s unemployment rates.
According to studies, in 2021, Jordan’s poverty line is 68 dinars (about $95) per person per month, and 1 million Jordanian people live below the poverty line. The study indicates that extreme poverty rates in Jordan are relatively high. Some 300,000 Jordanians live above but close to the poverty line, indicating that the poverty rate would have been 19.2% without government support.
As a result of thousands losing their jobs during the pandemic, the lack of social protection requirements for many social groups became more evident. Especially for workers in the unorganized sectors that increased in percentage during the covid outbreak at the expense of the organized sector. This issue requires attention to the most vulnerable groups and providing them with necessary social protection.
UNHCR and the World Bank in December 2020 found that since the beginning of the Covid-19 pandemic, poverty levels had increased by 38% among Jordanians and 18% among Syrian refugees, who already had higher levels of poverty. The number of refugees hosted by the Hashemite Kingdom of Jordan at that time was as high as 702,506 and 870 asylum-seekers.
Indicators Poverty 2010 (JD = 1.41 US$)
| Indicators | 2010 |
| Absolute Poverty Line (US$ per capita yearly) | 1,139.6 |
| Abject Poverty Line (US$ per capita yearly) | 470.4 |
| Non- Food Poverty Line (US$ per capita yearly) | 669.2 |
| Ratio Poverty (persons %) | 14.4 |
| Poverty Gap | 3.6 |
| Poverty Severity | 1.21 |
Source : Department of Statistics.
Construction
According to the General Statistics Service, the number of licensed housing units increased by 2.14% in 2020 compared to 2019, and the estimated cost of housing buildings was $611.9 million, 0.23% higher than in 2019.
The number of housing permits issued in 2020 also increased by 5.5%, compared to those issued in 2019.
According to the Jordanian Central Bank, real estate trading in 2020 declined by 26% compared to 2019. The real estate price index fell by 1.0% due to the fallout from the Covid-19 pandemic.
Tourism
Jordan’s tourism income rose by 14.3% in the first eight months of 2021, for the first time since the Covid pandemic, compared to the same period in 2020. According to the Central Bank, Jordan’s tourism income reached 959 million dinars ($1.352 billion) during the first eight months of 2021, compared to 839 million dinars ($1.183 billion) during the same period in 2020.
Jordan has dozens of tourist sites, the most notable ones are Petra’s archaeological city, one of the Seven Wonders of the New World, and the Dead Sea, which is the lowest spot-on earth, not to mention its therapeutic properties, and the dip where Jesus Christ’s pillar is located.
Jordan’s economy mainly depends on its tourism income, accounting for about 14% of total domestic output.
The Kingdom’s tourism income fell to $1.4 billion in 2020, 76% lower than in 2019, as a result of the Covid-19 pandemic, with the government shutting down airports in 2020 for about six whole months and repeatedly postponing reopening due to fears of a rise in covid cases.
Some of the tourism sector indicators
| Indicators | 2019 | 2020 | Change ± |
| Number of Classified Hotels | 270 | 285 | 15 |
| Number of Rooms (Classified Hotels) | 20,442 | 22,213 | 1,771 |
| Number of Beds (Classified Hotels) | 36,833 | 37,166 | 333 |
| Passengers by Jordanian Airlines (000) | 4,134.9 | 923.0 | -3,211.9 |
| Passengers by Foreign Airlines (000) | 5,092.3 | 1,127.8 | -3,964.5 |
Source : Department of Statistics.
Banking
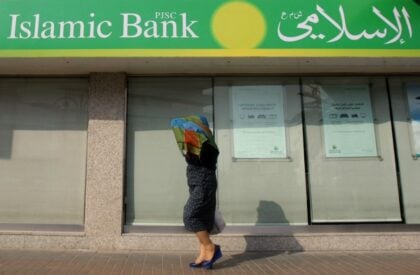
According to a report by the Bank of Jordan, despite the Covid-19 pandemic and its negative effects on the national economy in its various sectors, the banking sector indicators confirm its integrity and strength in being able to deal with the consequences of the pandemic. The minor impacts on those indicators are due to:
- Allowing banks to restructure individual and corporate loans, especially medium and small, affected by the consequences of covid-19 by postponing credit facility premiums for individuals and companies without commissions and interest delays.
- Pumping additional liquidity into the national economy worth 1.050 billion dinars ($1.480 billion) by reducing the mandatory cash reserve from 7% to 5%, reducing the cost of financing.
- Increasing the duration of existing and future facilities for economic sectors, including medium and small enterprises, through the Central Bank’s Economic Sector Finance and Support Program and by 500 million dinars ($705 million), and other actions.
To focus on the banking sector:
The decrease in concentration and the high level of competitiveness in the Jordanian banking sector continued in 2020, where the assets of the five largest banks out of the 24 banks constituted 54.1% of the total licensed banks at the end of 2020, compared to approximately 60% at the end of 2006. According to the Central Bank of Jordan, this is due to the improvement in banks developing their businesses and products to increase their competitiveness.
International Market Position
Jordan was ranked 65th out of 137 countries covered by the Global Competitiveness Index 2017-2018, down two places from 2016-2017, but sustained a relatively good ranking overall, benefitting from a fairly stable and efficient institutional system as well as relatively good infrastructure, innovation and business development.
The World Bank attributed this to measures taken by the government to consolidate the country’s fiscal and macroeconomic environment by raising taxes and increasing control over public spending, in response to the pressure exerted on the country by the large influx of Syrian refugees.
Labour Force
According to Jordanian labour market indicators, about 50% of the labour market for 2020 is below the secondary level of education. This proportion varied considerably between males and females, where about 66.7% of all female workers hold a bachelor’s degree. In comparison, 24.6% of all male workers hold a bachelor’s degree, indicating that the educational level of female workers is higher than that of male workers.
During 2020, most of Amman’s capital city workers concentrated at 38.6% of the total workforce in the country, 37.6% were male and 42.8% female. The provinces of Irbid and Zarqa had the highest concentration of workers after the capital Amman, with an employment rate of 19.8% and 12.6%, respectively. The provinces of Banquet and Altaqi were the least concentrated of workers, with ratios of 2.2% and 1.7%, respectively.
According to the 2020 Labour Force Survey results, Jordanian workers are concentrated exclusively in activities that separate them from other countries, adding to the workforce’s uniqueness:
- 26.9% work in Public Administration and Defence, Compulsory Social Security.
- 14.4% work in the sectors of Wholesale and Retail Trade, Motor Vehicle Repair, Pyrotechnics.
- 12.6% are employed in the Education sector.
- 10.4% are employed in the Manufacturing sector.
The least worked jobs were as follow:
- Household activities as an employer, household activities to produce goods and services that are not distinctive for their own use,” at 0.3%.
- Water supply and sewerage activities, waste management and treatment,” “activities of organizations and bodies outside the territorial jurisdiction,” and “arts, recreation, and recreation” by 0.4%.
- And real estate, by 0.5 percent.
Infrastructure

Compared to other developing countries, Jordan’s infrastructure is well developed, with the exception of the railway system. A report of the World Economic Forum stressed that the country’s overall transportation, communications, power, and information technology – which are considered the backbone for strengthening any country’s productivity and competitiveness – were healthy.
The same report said that Jordan’s infrastructure ranked 61st out of 139 countries, scoring 4.1 out of a possible seven points.
Jordan’s roads ranked 44, port infrastructure 64, air transport infrastructure 35, electricity supplies 38, fixed telephone lines 100, mobile telephone subscriptions 68, and availability of the latest technology 49.
The government is also working to improve its national railway services. The Jordan Times recently reported that the government has completed studies for a National Railway Network, linking Mediterranean countries, including Turkey, with the Persian Gulf through Jordan. The project is expected to cost about USD 3.4 billion.
Economic experts argue, though, that there are more important priorities in the kingdom’s economy. Negotiations are also underway to establish the Amman-Zarqa light-rail line, which is intended to serve the two most populous cities in the kingdom; thousands of Jordanians wait for hours every day to use public transportation to shuttle between the two cities. The government issued tenders for this project in 2005, 2007, and 2009, but it has not yet materialized.
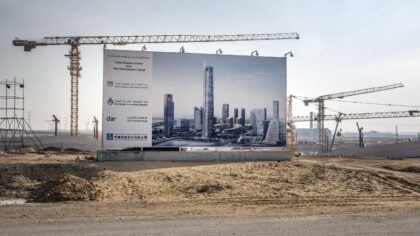
In order to attract major international investment, the government is working to develop its infrastructure across the kingdom, including that which will serve major real-estate projects, particularly its transport sector, including the rail system, Amman’s Queen Alia Airport, and the port of Aqaba.
Energy
For an in-depth overview of Jordan’s energy sector click on the button below.
Basic Indicators
| Indicators | 2019 | 2020 | Change ± |
| Total public revenues (Local and external grants) (billion US$) | 10.934 | 9.911 | -1.023 |
| Total public expenditure (billion US$) | 12.426 | 12.988 | 0.562 |
| Budget deficit after external grants (billion US$) | 1.492 | 3.077 | 1.585 |
| External grants (billion US$) | 1.112 | 1.115 | 0.003 |
| Public debt to GDP (%) | 75.8 | 85.4 | 9.6 |
| Fiscal year | Gregorian | Gregorian | - |
| Discount rate of the central bank (%) | 2.5 | 2.5 | - |
| Inflation (%) | 0.80 | 0.30 | -0.50 |
| Net foreign reserves (billion US$) | 13.95 | 15.91 | 1.96 |
| Exchange rates (US$ per JOD) | 1.41 | 1.41 | - |
Source : Central Bank data
Latest Articles
Below are the latest articles by acclaimed journalists and academics concerning the topic ‘Economy’ and ‘Jordan’. These articles are posted in this country file or elsewhere on our website: